The Concepts of Support and Resistance
Two key pillars of technical analysis are support and resistance. To correctly interpret price charts, it’s essential to grasp the meaning of these concepts and how to apply them in practice.
Price movements are primarily driven by the interplay between supply and demand. When demand exceeds supply, prices go up, while they go down when supply outstrips demand. At times, prices may remain stagnant as both supply and demand are balanced.
The support
In technical analysis, support is a price level at which a security or an asset is expected to stop falling and begin to rise again due to an increase in buying pressure. It is a key concept used to identify potential buying opportunities in financial markets. In other words support refers to a specific price level or zone that reflects buyers’ willingness to purchase a security or asset. This area demonstrates a level of demand that exceeds supply, leading to a halt in price decline and often a subsequent reversal.
The Resistance
Resistance is the opposing force of support in technical analysis. It represents a price level or zone where selling pressure outweighs buying pressure, causing prices to stop rising and potentially reverse. Identifying these levels can serve as potential entry or exit points for traders, as prices tend to either bounce off or break through them and continue in their prior direction. Timing trades based on these levels can help traders quickly determine if they are correct and cut losses or ride out substantial gains accordingly.
How it this useful
Resistance and support zones can be used as potential entry or exit points for traders. As the price reaches these levels, it may either bounce back from the support or resistance level, or break through and continue in its previous direction until it reaches the next support or resistance level.
Trades can be timed based on the assumption that support and resistance zones will remain intact. Traders bet on the direction of price and quickly assess their accuracy, whether the price is halted by or breaks through these levels. If the price moves against the trader’s bet, the position can be closed at a minor loss. If the price moves in the predicted direction and respects support or resistance levels, substantial gains may be realized.
how support and resistance are identified
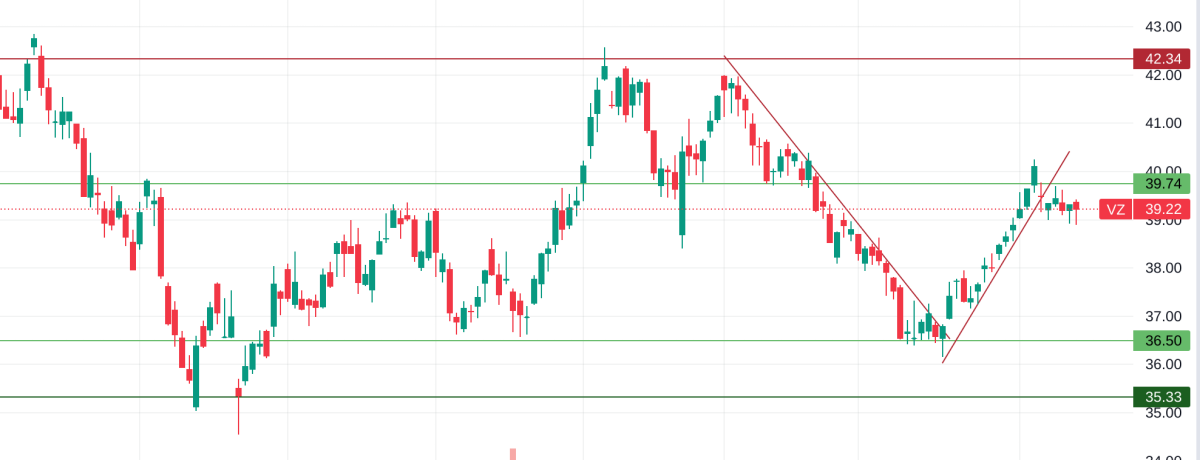
To identify support and resistance levels, traders and investors look for areas on a price chart where the price has bounced off or stalled in the past. These areas can be identified by drawing trendlines or horizontal lines on the chart connecting the relevant price points.
For example, if a stock has consistently bounced off a certain price level, say $36.5-37, traders would identify that as a support level. On the other hand, if the stock has consistently failed to break above a certain price level, say $42, traders would identify that as a resistance level.

Another method for identifying support and resistance levels is using technical indicators such as moving averages or Fibonacci retracements. Moving averages can help identify support and resistance levels by highlighting the average price over a certain period of time. Traders can use these averages to identify areas where the price is likely to bounce or stall. Fibonacci retracements, on the other hand, are based on a series of mathematical ratios that can help traders identify potential support and resistance levels. These ratios are derived from the Fibonacci sequence and can be plotted on a price chart to identify areas where the price is likely to bounce or stall.
Support and resistance can also be identified by analyzing the volume of trading. Higher volume often indicates significant buying or selling pressure at certain price levels, which can act as support or resistance.
For example, if a stock has been trading in a range between $50 and $60, and there is a sudden surge in buying volume when the price reaches $50, it may indicate a strong level of support. On the other hand, if there is a sudden increase in selling volume when the price reaches $60, it may indicate a strong level of resistance.
Traders can also use technical indicators such as on-balance volume (OBV) or volume-weighted average price (VWAP) to help identify support and resistance levels based on volume. These indicators measure the cumulative volume of buying and selling over a given period, which can reveal areas of significant buying or selling pressure.
Moving Average (MA)
Moving Average (MA) is a widely used technical indicator that helps traders and analysts to analyze the trend and momentum of a financial instrument’s price. It is the average of a specific number of past prices, usually calculated over a certain period of time, which is continuously updated as new prices become available.
The most commonly used moving averages are the Simple Moving Average (SMA) and the Exponential Moving Average (EMA). SMA is calculated by adding up the closing prices over a certain number of periods and then dividing the sum by the number of periods. EMA, on the other hand, places greater weight on more recent prices, making it more responsive to recent price changes.
Moving averages are used to identify trends and reversals in the market. When the price of an asset is above its moving average, it is considered to be in an uptrend, and when the price is below the moving average, it is considered to be in a downtrend. Traders also use moving averages to identify potential support and resistance levels, as well as to generate trading signals when the shorter-term moving average crosses above or below the longer-term moving average.
For example, a trader may use a 50-day and 200-day moving average to identify potential trends in a stock’s price. If the 50-day moving average crosses above the 200-day moving average, it could signal a bullish trend and a buy signal. Conversely, if the 50-day moving average crosses below the 200-day moving average, it could indicate a bearish trend and a sell signal.
Fibonacci retracement
Fibonacci retracement is a technical analysis tool used to identify potential areas of support and resistance in a price trend. It is based on the idea that after an asset price makes a significant move, it will often retrace a predictable portion of that move before resuming its prior direction.
The Fibonacci retracement tool is used by drawing lines between two extreme points on a chart, typically the high and low points of a trend. The tool then automatically calculates levels representing potential retracement points based on ratios derived from the Fibonacci sequence.
The Fibonacci retracement levels are 23.6%, 38.2%, 50%, 61.8%, and 78.6%. These levels represent the percentage that a stock price could retrace from its high or low, before resuming its prior trend. Traders use these levels to identify potential areas of support and resistance where they might consider entering or exiting a trade.
For example, if a stock’s price is in an uptrend and reaches a new high, a trader might use the Fibonacci retracement tool to identify potential support levels if the price retraces. The tool might identify the 38.2% level as a potential support level, meaning that the price could retrace up to 38.2% of the prior move before resuming its uptrend.
Fibonacci retracement is a popular tool among traders because of its ability to identify potential areas of support and resistance. However, it is important to note that it is not a foolproof indicator and should be used in conjunction with other technical analysis tools and fundamental analysis.
On-balance volume (OBV)
On-balance volume (OBV) is a technical analysis tool used to track the buying and selling pressure of an asset. It does this by adding or subtracting the volume of an asset based on whether the price has moved up or down for that period. The idea behind OBV is that volume often leads price movements. In other words, if volume is increasing as the price is rising, this indicates strong buying pressure, and the trend is likely to continue. Conversely, if volume is decreasing as the price is rising, this may indicate weak buying pressure, and the trend could be at risk of reversing.
On-balance volume (OBV) is calculated by adding the volume on up days and subtracting the volume on down days. The result is then added to the previous day’s OBV value. Here are the steps for calculating OBV:
- Start with the first day’s closing price and volume.
- If the current day’s closing price is higher than the previous day’s closing price, add the current day’s volume to the OBV value.
- If the current day’s closing price is lower than the previous day’s closing price, subtract the current day’s volume from the OBV value.
- If the current day’s closing price is the same as the previous day’s closing price, do not add or subtract anything from the OBV value.
- Repeat steps 2-4 for each subsequent day.
By calculating OBV in this way, the indicator provides a running total of the volume for a security, indicating whether buying or selling pressure is increasing or decreasing. If the OBV is rising, it suggests that buying pressure is increasing, while a falling OBV suggests that selling pressure is increasing. Or can can be viewed like this:
- If the OBV line is trending upward and the price is also moving upward, this suggests a bullish trend.
- If the price falls while the OBV line continues to move upward, this could be a signal of a bullish divergence, which could indicate a potential price reversal. * If the OBV line is trending downward and the price is also moving downward, this suggests a bearish trend.
- If the price rises while the OBV line continues to move downward, this could be a signal of a bearish divergence, which could indicate a potential price reversal.
However, like any technical analysis tool, it should not be used in isolation and should be combined with other indicators and analysis techniques for more accurate trading decisions.
Volume-weighted average price (VWAP)
Volume-weighted average price (VWAP) is a technical analysis tool that calculates the average price of a security over a specified period of time, based on both the price and volume of trades.
VWAP is calculated by adding up the total dollar amount of all transactions that occurred during a given period and then dividing that by the total volume of shares or contracts traded during that same period. The formula for calculating VWAP is:
VWAP = ∑ (Price x Volume) / ∑ Volume
where:
- Price = the price of each transaction
- Volume = the number of shares or contracts traded in each transaction
- ∑ = summation notation (adding up all transactions over a period of time)
Traders use VWAP as a benchmark for the current price of a security. If the current price is above the VWAP, it is considered bullish, while if the current price is below the VWAP, it is considered bearish. Additionally, traders may use VWAP to identify potential areas of support and resistance, as well as to make decisions about buying or selling a security based on whether it is trading above or below the VWAP.
Summary
The concepts of support and resistance are two key pillars of technical analysis that traders and investors use to identify potential buying or selling opportunities in financial markets. Support refers to a price level at which a security or asset is expected to stop falling and begin to rise again due to an increase in buying pressure, while resistance represents a price level or zone where selling pressure outweighs buying pressure, causing prices to stop rising and potentially reverse. Traders and investors identify these levels by looking for areas on a price chart where the price has bounced off or stalled in the past. They can also use technical indicators such as moving averages or Fibonacci retracements, as well as analyze the volume of trading to identify areas of significant buying or selling pressure. Moving averages are widely used technical indicators that help traders and analysts to analyze the trend and momentum of a financial instrument’s price.