The Point-and-Figure (P&F) Chart
A point-and-figure (P&F) chart plots price movements, without taking into consideration the passage of time. Thus there is no time axis, only a price axis. No movement in price means no change in the P&F chart.
P&F charts utilize columns consisting of stacked X’s for rising prices or O’s - falling prices, each of which represents a set amount of price movement. There are no time dimensions, but still it’s chronological.
The set amount also called the box size or unit of price and needs to be predefined for the stock or index. The second parameter is reversal amount, we will describe it down below.
Unique advantages of P&F Charts
First let’s understand the advantages of P&F charts
- Focus on important price movements (Filtering of insignificant price movements or noise)
- Remove the time aspect from the analysis process
- Make support/resistance levels much easier to identify
- Provide automatic and subjective trend lines
Some argue that support and resistance levels, as well as breakouts, are more clearly defined on a P&F chart since it filters out tiny price movements and is less susceptible to false breakouts.
Constructing the P&F Charts
- An X is created when the price moves higher by a box size amount.
- An O is created when the price drops by a box size amount.
- X’s and O’s never appear in the same column.
- The box size is set based on the asset’s price and the investor’s preference.
- The formation of a new column of X’s or O’s occurs when the price moves contrary to its current trend, and does so by more than the reversal amount.
Besides the box size the reversal amount is the second parameter that also needs to be set. The reversal amount is typically three times the box size. For example, if the box size is $1, the reversal amount is $3, but it’s up to you. The 3-box Reversal Method is the most popular P&F charting method.
- The reversal distance is the box size multiplied by the reversal amount.
Let’s understand it on the example of SPX..
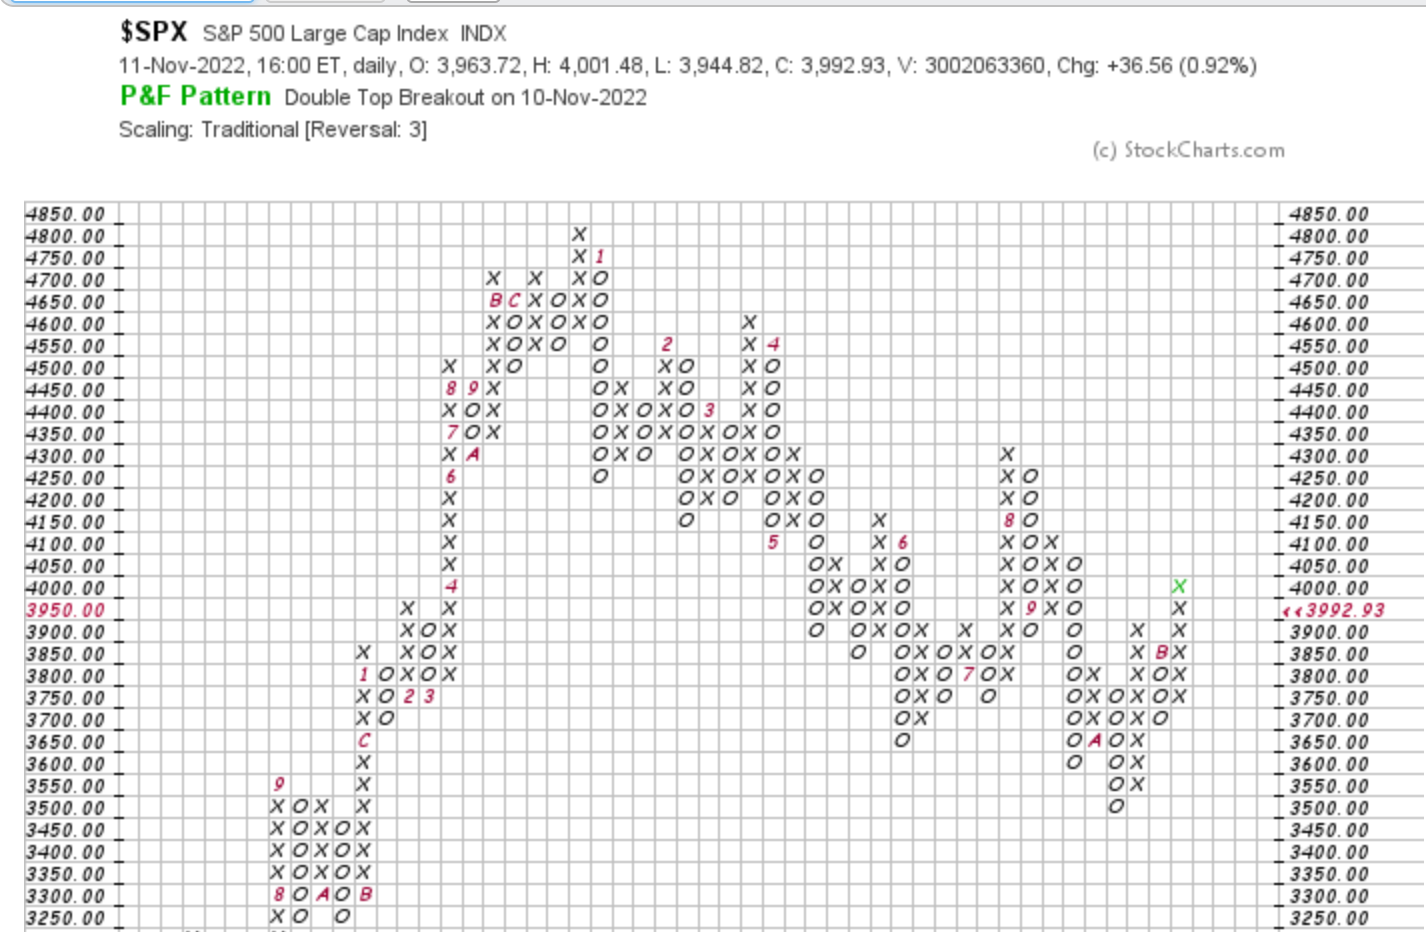
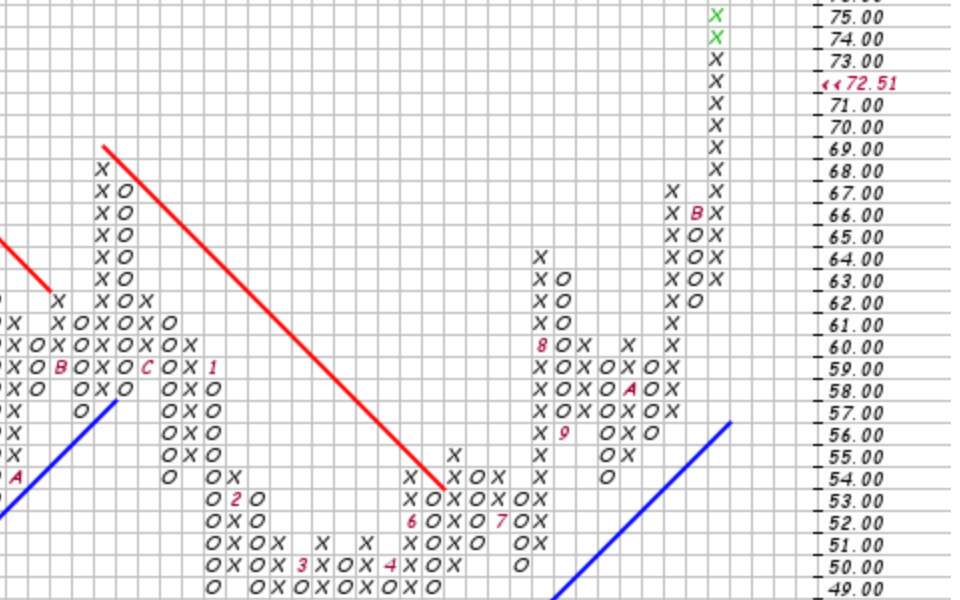
The first thing that we see in this chart are those numbers 1-9 as well the letters “A”, “B”, and “C”. Well, what could it be? In P&F charts, the spacing between price changes will not be symmetrical in the time dimensions. The chart evolves only when there is a price change big enough to warrant a new X, a new O, or a new reversal column. Numbers and letters on the chart indicate when a new month has begun. For instance, the number “4” shows where April has started. The letters “A”, “B”, and “C” are used to indicate the beginning of October, November, and December.
Secondly, we read from the chart that the box amount is 50 index basis points.
Ok, let’s compare November to the Candle Stick chart.
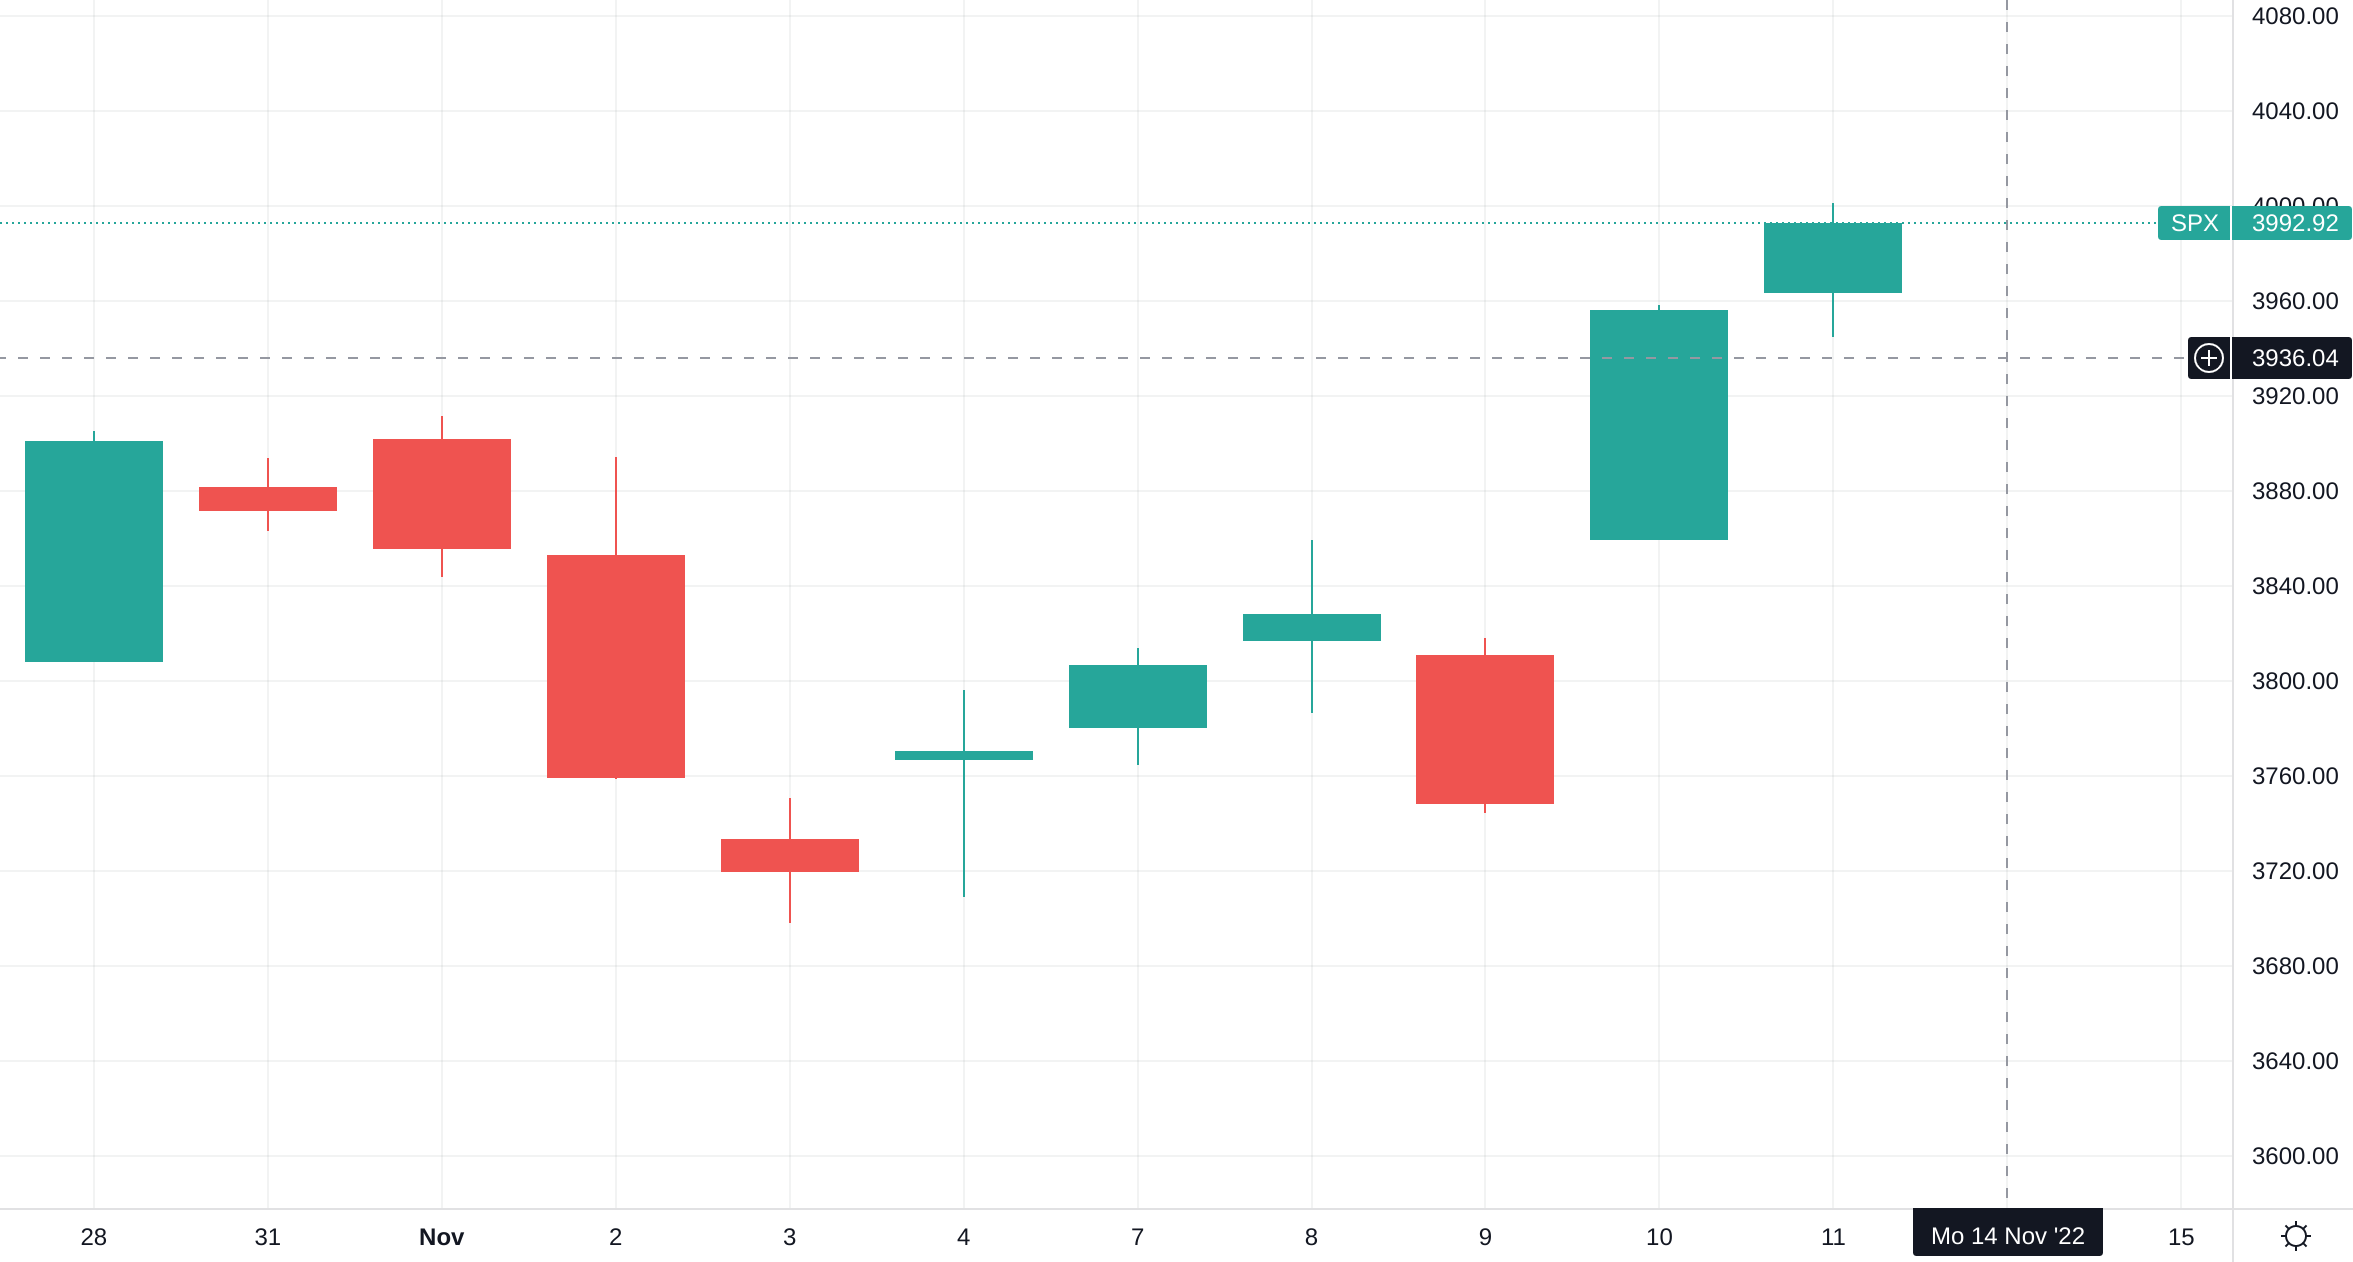
As we see November 2 produced two O, and November 3. add one O as markes go down to 3700. then the Marked decided to turn, but the P&F chart was not updated because the upward movement has to be greater than 150 bp. It was reached on November 10. It’s interesting to notice that the bearish November 9 is not visible in the P&F chart - and is filtered as “noise”.
I hope that makes the magic of P&F visible to you…
The careful reader would also see that the P&F is indicating the presence of Double Top Breakout
Patterns
Usually, the P&F users know about five bullish breakout P&F patterns. The most basic P&F bullish signal is a Double Top Breakout. Double Top Breakout happens when an X-Column breaks above the high of the prior X-Column. These two columns are separated by an O-Column.
We can also break it down as following:
- The first rising X-Column establishes the direction,
- The middle O-Column represents a bounce that establishes support.
- The third X-Column triggers the higher high (the break out).
The ability to break above the prior high shows strength associated with an uptrend.
However, Double Top Breakout is a very basic and most error-prone pattern in P&F. Chart analysis should never be used alone for trading decisions! I hope this overview helps to understand the basics of P&F charting.