Fear and greed indicator: The overview
The fear and greed indicator is a tool that helps investors understand the general mood of the stock market. It shows whether people are feeling more “fearful” (worried) or “greedy” (excited and willing to take risks) about buying stocks.
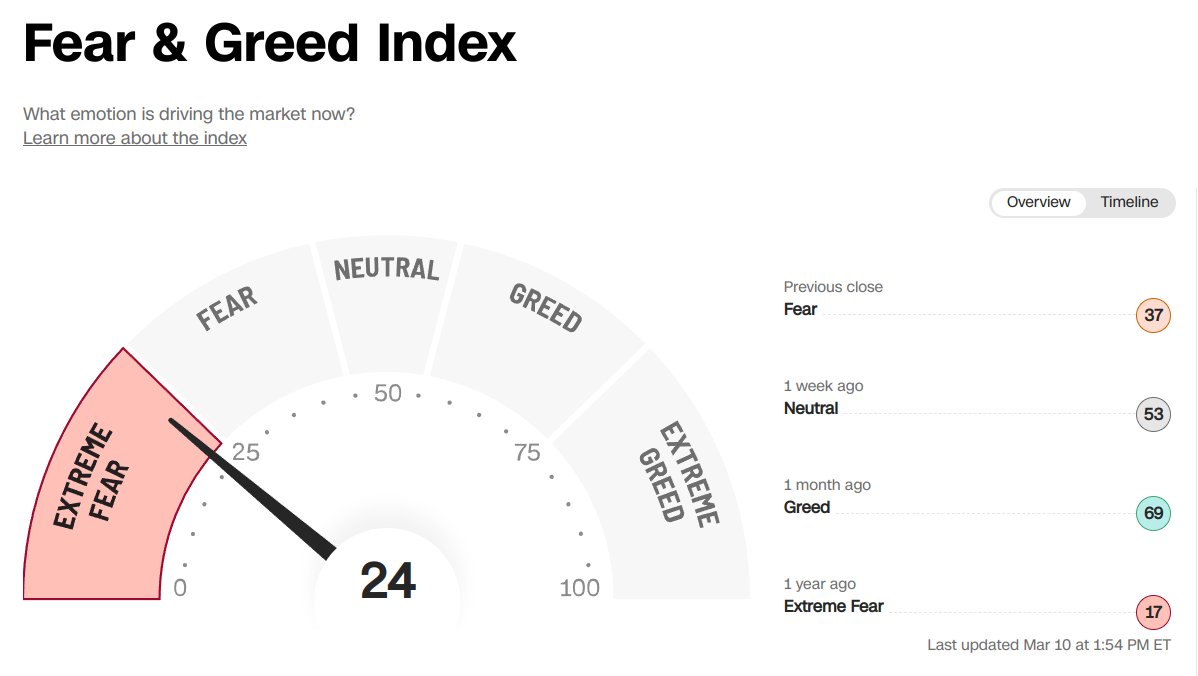
The indicator goes from 0 to 100:
- 0 means people are feeling extreme fear and are being very careful, not taking big risks.
- 100 means people are feeling extreme greed and are willing to take bigger risks, hoping to make more money.
If the indicator is high, it means most investors are feeling bold and eager to buy, often driving stock prices up. If it’s low, it means most people are being cautious and might not buy as much, which can lead to lower stock prices.
How the Index is calculated
The fear and greed indicator is calculated using a combination of different market factors. The specific factors and weights assigned to each factor may vary depending on the methodology used. Here is an example of how the indicator can be calculated:
-
Volatility (25%): The CBOE Volatility Index (VIX) is a popular measure of market volatility. A high VIX level indicates that investors are more fearful and vice versa.
-
Market Momentum (25%): The S&P 500 index is used as a proxy for overall market momentum. The percentage of stocks that are trading above their 50-day moving average is used to determine the market momentum. When a large percentage of stocks are trading above their 125-day (sometime other ranges) moving average, it suggests that investors are feeling more bullish, and the market is likely to be in an uptrend. Conversely, when a small percentage of stocks are trading above their 50-day moving average, it suggests that investors are more bearish, and the market is likely to be in a downtrend.
-
Safe Haven Demand(25%): The difference between the yield of the 10-year Treasury bond and the Federal Funds rate is used as a proxy for safe haven demand. When the difference between these rates is high, it suggests that investors are seeking safety in Treasuries, indicating fear. Bonds do better when investors are scared. Conversely, when the difference is low, it suggests that investors are seeking riskier assets, indicating greed.
-
Put/Call Ratio (12.5%): The put/call ratio measures the ratio of bearish (put) options to bullish (call) options traded on the market. A high put/call ratio suggests that investors are more bearish, indicating fear, while a low put/call ratio suggests that investors are more bullish, indicating greed.
-
Junk Bond Demand(12.5%): The difference between the yield of high-yield bonds and the yield of 10-year Treasury bonds is used as a proxy for junk bond demand. When the difference is low, it suggests that investors are more willing to take risks, indicating greed. Conversely, when the difference is high, it suggests that investors are more risk-averse, indicating fear. The junk bond demand is assigned a weight of 12.5% in the calculation of the fear and greed indicator.
The fear and greed indicator is then calculated as a weighted average of these five factors, with each factor assigned a specific weight based on its importance. The weights may vary depending on the methodology used, but the above example illustrates how the indicator can be calculated.
Variations
Different investors and analysts may have different opinions on which market factors are most important in determining market sentiment, and different methodologies may be more appropriate for different types of markets or investment strategies.
For example, a long-term investor may place more weight on factors like safe haven demand and market momentum, while a short-term trader may be more focused on factors like volatility and the put/call ratio. Similarly, the weight assigned to each factor may vary depending on the market conditions and the specific time period being analyzed.
In addition, the fear and greed index is not an exact science and is subject to interpretation. Different methodologies may produce slightly different results, and investors should use their own judgment and analysis when interpreting the results of the fear and greed index.
The most well-known fear and greed index is the CNN Business Fear & Greed Index, which uses the methodology I described earlier. However, there are other versions of the fear and greed index that use different methodologies, such as the Fear & Greed Index developed by MarketWatch or the Fear & Greed Index developed by SentimentTrader.
How to use Fear and Greed
The fear and greed indicator can be used by traders and investors as a tool to gauge market sentiment and identify potential buying or selling opportunities. Here are a few ways that investors can use the fear and greed indicator:
-
Identify overbought or oversold conditions: When the fear and greed indicator reaches extreme levels, it may signal that the market is overbought or oversold. An extreme reading of greed could indicate that the market is overbought and due for a correction, while an extreme reading of fear could indicate that the market is oversold and due for a rebound.
-
Assess market sentiment: The fear and greed indicator can be used to gauge market sentiment and identify trends. For example, if the indicator has been trending upwards for several weeks, it may signal that investors are becoming more optimistic about the market.
-
Identify potential buying or selling opportunities: The fear and greed indicator can be used to identify potential buying or selling opportunities. For example, if the indicator reaches an extreme level of fear, it may present a buying opportunity for investors who believe that the market is oversold and due for a rebound. On the other hand, if the indicator reaches an extreme level of greed, it may present a selling opportunity for investors who believe that the market is overbought and due for a correction.
It is important to remember that the fear and greed indicator is just one tool among many that investors can use to make informed investment decisions. Investors should use multiple sources of information and analysis to assess market conditions and identify potential opportunities. Additionally, investors should do their own research and analysis before making any investment decisions.